当前城市:淄博[切换]
- 手机雅思无忧

扫码登录
雅思考试主要是通过对考生听、说、读、写四个方面英语能力的考核,综合测评考生的英语沟通运用能力,实现“沟通为本”的考试理念。对于雅思考生来说,也有很多考试难点和政策盲区需要帮助解答。今天雅思无忧网小编准备了文章雅思写作:Task1曲线图考官范文(17),希望通过文章来解决雅思考生这方面的疑难问题,敬请关注。
The graph below shows the unemployment rates in the US and Japan between March 1993 and March 1999.
Write a report for a university lecturer describing the information shown below.
Sample Answer:
The given graph compares the unemployment rates in Japan and the USA from 1993 to 1999. As is observed from the given graph, initially in 1993, USA has a higher unemployment rate than it was in Japan but in few years, the USA managed to control this rate and got in a better position that Japan.
According to the line graphs, the unemployment rate in USA was over 7% in 1993 and over time this rate kept on decreasing. Finally in 1999, the unemployment rate in the USA decreased to just over 4.5% which shows the improvement the USA had been able to achieve. On the contrary, in 1993, Japan had about 2% unemployment rate but that kept on increasing over the year and after 6 years it reached to over 4.5%. Japanese job market showed a completely opposite trend than the USA job market.
In summary, the USA managed to control the unemployment rate better than Japan did for the given period though initially Japan had less unemployment problem than the USA.
最新热文推荐:
以上就是雅思无忧网为您准备的访问雅思无忧网(https://www.yasi.cn/),了解更多雅思考试新消息,新动态。
 请问雅思口语考试流程和时间安排(雅思口语考试流程注意事项以及考官投诉)
请问雅思口语考试流程和时间安排您好,我是专注留学考试规划和留学咨询的小钟老师。选择留学是人生重要的决
2026年01月20日 01:48 国际教育展在各省市陆续来开帷幕,现场对话雅思考官
各地官方教育展提供一手的雅思考情资讯在2026年多个省市陆续承办不同规模海外教育展,展会现场雅思考官
2026年05月04日 12:46 保定环球教育教你雅思写作流程图答题技巧! 新版//剑桥雅思12Test8流程图解析+范文
保定环球教育教你雅思写作流程图答题技巧!应对雅思写作流程图,需了解其类型、写作要点、连接词和常用动词
2026年02月16日 23:20 雅思百问第17问:听说雅思考试有好几种类型,我要去英国留学,该报哪个类型的雅思考试?
英国留学3种常见的雅思考试类型,你应该考哪种?英国留学常见的三种雅思考试类型为普通雅思、英国移民及签
2026年02月10日 03:45 2026年7-9月雅思考试场次正式公布,今日17:00开放报名
7-9月考位已上线,覆盖全国40+城市2026年7-9月雅思考试(IELTS)、用于英国签证及移民的
2026年06月22日 16:34 雅思成绩单7月17日起全球改版,新增Ofqual官方标识
7月17日起全球成绩单启用新版式自2026年7月17日起,全球雅思成绩单(TestReportFor
2026年07月08日 14:08 雅思小作文范文-柱状图-各地房价(雅思作文饼图和柱状图的区别)
雅思小作文范文-柱状图-各地房价Thebarchartillustratesthefluctuati
2026年02月22日 03:45 大学雅思资料申请流程图 剑桥雅思16T2流程图范文-糖的制作
1.16雅思考回|“写作流程图”不愧是我,百密有一疏!2021年1月16日雅思考试写作部分流程图题目
2026年02月23日 13:00 雅思利弊分析类范文 建议普通家庭大学生考雅思这样做...
雅思利弊分析类范文以下是一篇关于雅思考试中可能的利弊分析类范文:题目:雅思考试对国际教育与交流的利弊
2026年03月08日 05:31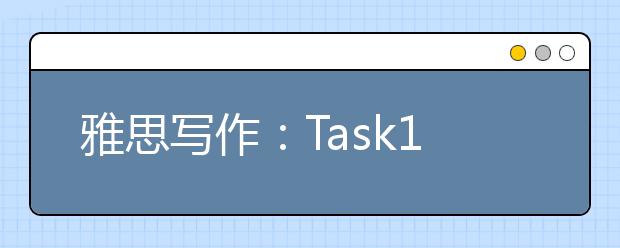 雅思写作:Task1曲线图考官范文(27)
The diagram shows the consumption of renewable ene
2021年10月07日 22:252022年10月06日
2021年11月29日
2021年06月19日
2021年06月11日
2021年06月09日
2025年04月27日
2025年04月27日
2025年04月27日
2025年04月27日
2025年04月27日
 雅思是什么意思 关于雅思的详细介绍
  北京雅思备考:雅思写作的注意事项
  雅思写作6.5分成绩怎么样?
  雅思写作步骤有哪些?
  雅思写作考试评分标准
  雅思英语作文高清 雅思保护环境英语作文...
 雅思英语作文简单 生物多样性的雅思英语作文...
 顾家北手把手教雅思写作和慎小嶷十天突破哪个...
 推荐2个英文写作免费修改网站 雅思掌门带你...
 雅思看图英语作文 求一片雅思英语作文 25...